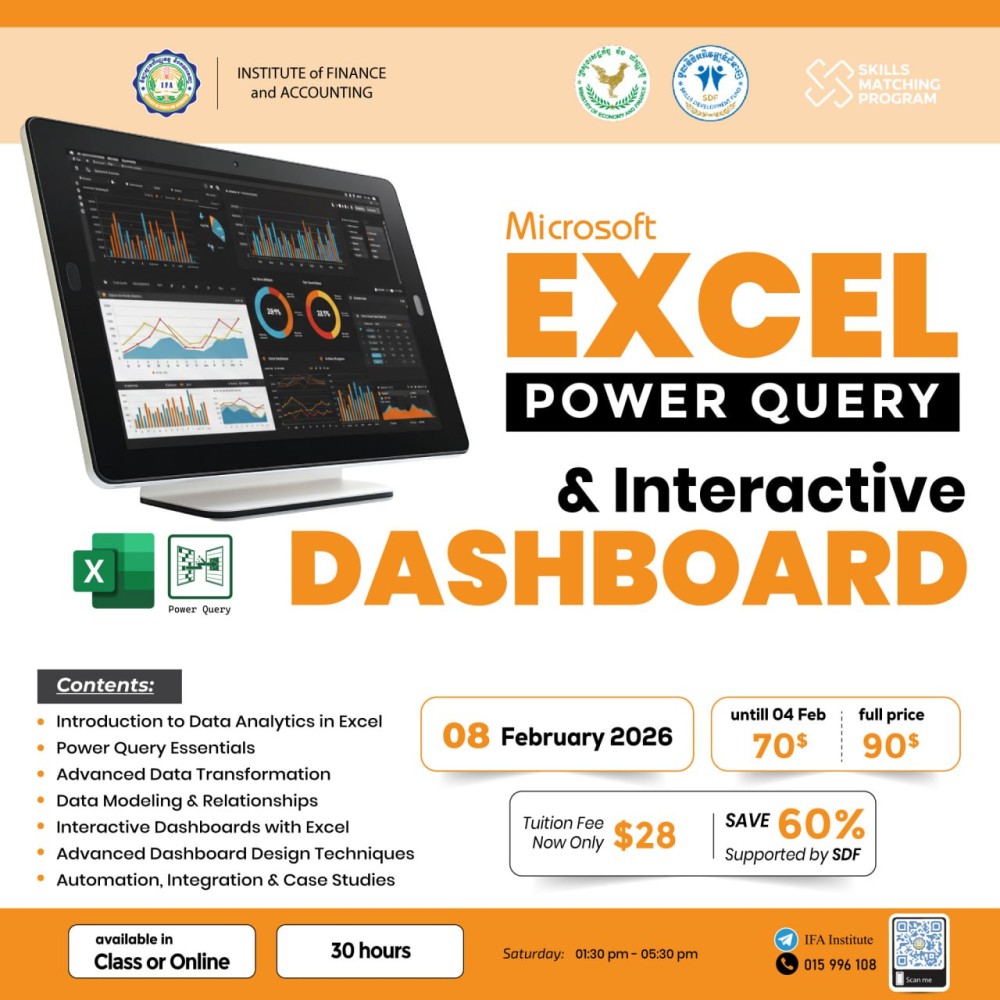
វគ្គថ្មីពិសេសស: “Financial Dashboard and Data Storytelling with Microsoft Excel” 🎯 Learning Outcomes 1. Understand the Role of Financial Dashboards • Explain the importance and purpose of dashboards in financial reporting and decision-making. • Differentiate between static reports and dynamic dashboards. 2. Prepare and Clean Financial Data for Visualization • Apply data cleaning, transformation, and preparation techniques using Excel tools like Power Query and PivotTables. 3. Use Advanced Excel Functions for Financial Analysis • Master functions such as INDEX, MATCH, XLOOKUP, IF, SUMIFS, TEXT, FILTER, and dynamic array formulas for financial insights. 4. Develop Key Financial Metrics and KPIs • Define and calculate essential KPIs such as profit margin, return on investment (ROI), working capital, and cash flow indicators. 5. Design and Build Interactive Excel Dashboards • Create dynamic dashboards using slicers, dropdowns, conditional formatting, and chart types to display trends and comparisons effectively. 6. Apply Data Storytelling Techniques • Craft compelling financial narratives using charts, annotations, and guided flow to help stakeholders understand the story behind the numbers. 7. Implement Automation and Optimization in Excel • Use macros, formulas, and automation techniques to streamline repetitive tasks and enhance dashboard performance. 8. Complete a Final Capstone Project • Build a complete financial dashboard project based on real-world scenarios, demonstrating all learned skills in data analysis and visualization. 💥ចូលរៀន: 04 តុលា 2025 👨🏻💻ចុះឈ្មោះសិក្សាផ្ទាល់ ឬតាមដំណភ្ជាប់ 💮 https://ifa.edu.kh/enrollment-form